From August 2021, Google will finish rolling out the Page Experience Update. Here’s what you need to know.
Note: this article was first written for Spark Foundry alongside Alex Bundock, and the original can be found on the Spark Foundry Blog.
What’s the Page Experience Update?
In May 2020, Google gave us a 12 month lead time on a new addition to their organic search algorithm, the “Page Experience” Update.
For the first time, Google will be taking into account measurable experience signals into how they rank sites in organic search results. These signals are based on Google’s new Core Web Vitals which are a distillation of Google’s speed data from sources like CrUX and Lighthouse as well as some new measurements to help site owners understand performance.
After a few months delay, and deciding to make this a long roll-out, Google has given a final deadline of August 2021 for them to start fully utilising these Core Web Vitals for ranking purposes.
What are Core Web Vitals and where can I see them?
Glad you asked! There are three core metrics:
1. Largest Contentful Paint (LCP)
Directly measures: When the largest content element in the viewport becomes visible
Relates to: Loading performance
Often caused by: Server response times, caching, render blocking script and CSS, resource load times and excessive file sizes
Contentful Paint measures perceived load speed because it marks the point in the page load timeline when the page’s largest piece of content has likely loaded.
For many websites, this is a hero banner image that is super-high res to create impact. Ensure these are compressed and delivered over a HTTP/2 or QUIC network, or use a Content Delivery Network.
2. First Input Delay (FID)
Directly measures: The time from when a user first interacts with a page to the time when the browser is actually able to begin processing event handlers in response to that interaction.
Relates to: Interactivity
Often caused by: Long tasks, script execution, layouts
First Input Delay (FID) measures load responsiveness because it quantifies the experience users feel when trying to interact with unresponsive pages.
Have you ever loaded a webpage and tried to click an un-responsive button, only for it to work a few seconds later? Frustrating, isn’t it! Ensure website visitors can interact with content and buttons from the second the site loads.
3. Cumulative Layout Shift (CLS)
Directly measures: The sum total of all individual layout shift scores for every unexpected layout shift that occurs during the entire lifespan of the page.
Relates to: Visual stability
Often caused by: Image dimensions, dynamic content, loading order
Cumulative Layout Shift (CLS) measures visual stability because it helps quantify how often users experience unexpected layout shifts.
This is especially prevalent for pages with a lot of individual pieces of content on a page, such as images, ads, dynamically-loading content and other media that loads after the written content.
Another user frustration occurs when they load a page, start reading the content and that content suddenly disappears a couple of scrolls down the page because a video or ad has loaded in its place. That’s layout shift, and that’s what Google wants to prevent.
All three of these metrics will factor into the Page Experience update and therefore a site’s performance in organic search.
You can read more of the technical detail here: https://web.dev/vitals/
What should I do?
The two key things to do are audit and plan.
From an auditing perspective, you don’t need to be a technical wizard to start identifying areas to fix. Google has a couple of key tools to help you:
Page Speed Insights

PageSpeed Insights is the first place you should start if you’re looking to understand the performance of core web vitals on your website.
The PageSpeed Insight tool performs a live test on the URL you enter and if you have a reasonably sized site will also include data from Google’s CrUX (Chrome User Experience) database which measures site performance directly from user browsers.
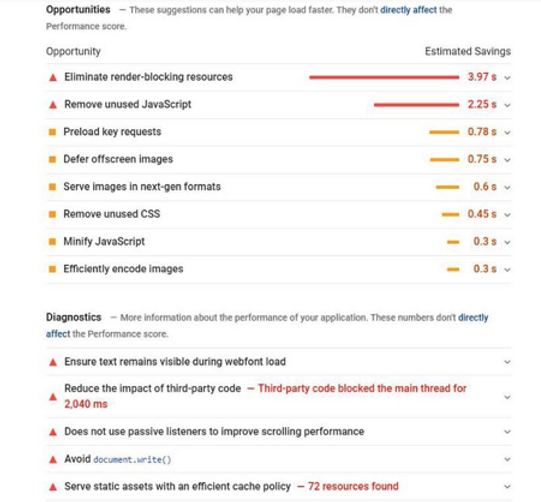
Not only do you get a breakdown of performance, but you’ll also get a breakdown of opportunities and diagnostics:

https://developers.google.com/speed/pagespeed/insights/?url=https%3A%2F%2Fwww.ato.gov.au&tab=mobile
Don’t be nervous about getting a low score, especially if you haven’t optimised for page speed and page experience before. It means there are plenty of opportunities for you to improve your Performance number.
Note that the data you get is only on the page you put in, so if you have a number of different templates across your site, you’ll either need to enter them manually, or hook up the Page Speeds Insights API to a tool like ScreamingFrog to get a good idea of broader performance issues and possible fixes site-wide.
Google CrUX Report
If you’re wanting to dig deeper into the data, then Google provides a free and easy way to directly query their CrUX dataset via Data Studio.
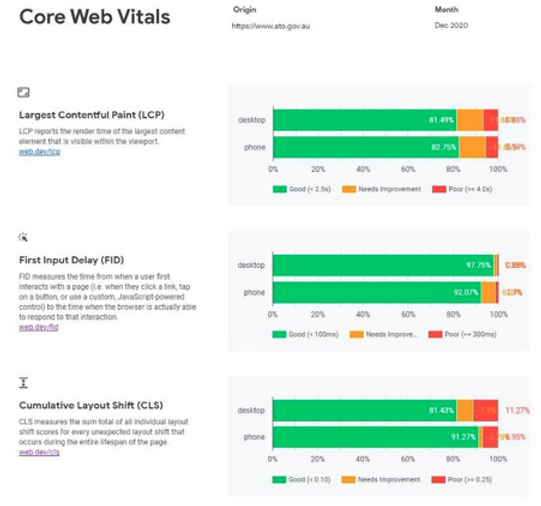
All you have to do is enter your URL and, if Google has any data, it will be returned in a pre-formatted report:

https://datastudio.google.com/reporting/112381c6-5d95-4f95-b93d-f9b99e0c0a8d
The dashboard goes into detail on performance over time across the three Core Web Vitals and other key speed metrics and allows you to break down by device.
Although it won’t provide the same diagnostics and opportunities as the PageSpeed Insights tool, it’s a good place to view your macro data (or even have a look at competitor websites).
API+Crawler
If you’re looking for the most granular data, you can find you can also connect the Google PageSpeed API to a crawler like Screaming Frog to get all the data and diagnostics for every URL:

Google Search Console
Google helpfully provides Search marketers like us with reports for both Page Experience and Core Web Vitals in our Search Console dashboard. It’s found on the left-hand navigation, alongside the Mobile Usability report.
The report will give you an understanding of how Google sees your pages on a Good, Needs Improvement, or Poor scale, and you can see how it changes over time. This is a great tool for planning which pages to tackle first, and for measuring the output of your efforts in creating a better experience for users.
From a planning perspective, the key is to work with your developers in understanding the cost/benefit and timelines of these changes.
Even if you miss the boat and the Page Experience update is either too close or has already rolled out, it’s never too early to start making improvements.
How big will the Core Web Vitals impact be?
As usual with Google updates, it’s impossible to know how big the impact will be before it’s rolled out. But, given the context of COVID and the effort and expense involved in optimising things like hardware and infrastructure, we don’t think it will have the huge impact of something like a Core Update on launch – but it will become a far more important component in the future.
Additional resources:
Deloitte — Milliseconds Make Millions (2020)
Pinterest — Driving user growth with performance improvements (2017)
Google — Why Does Speed Matter? (2019)
Final Word
And there you have it. A quick primer on the imminent Page Experience update from Google, and the Core Web Vitals metrics.
These metrics are intrinsically linked to your website’s visitors overall user-experience, and improving them can help improve the conversion rate of your website. They can also help improve your SEO performance if you have stronger CWV scores than your competitors, and you are at least in the Needs Improvement bracket.